Measurements
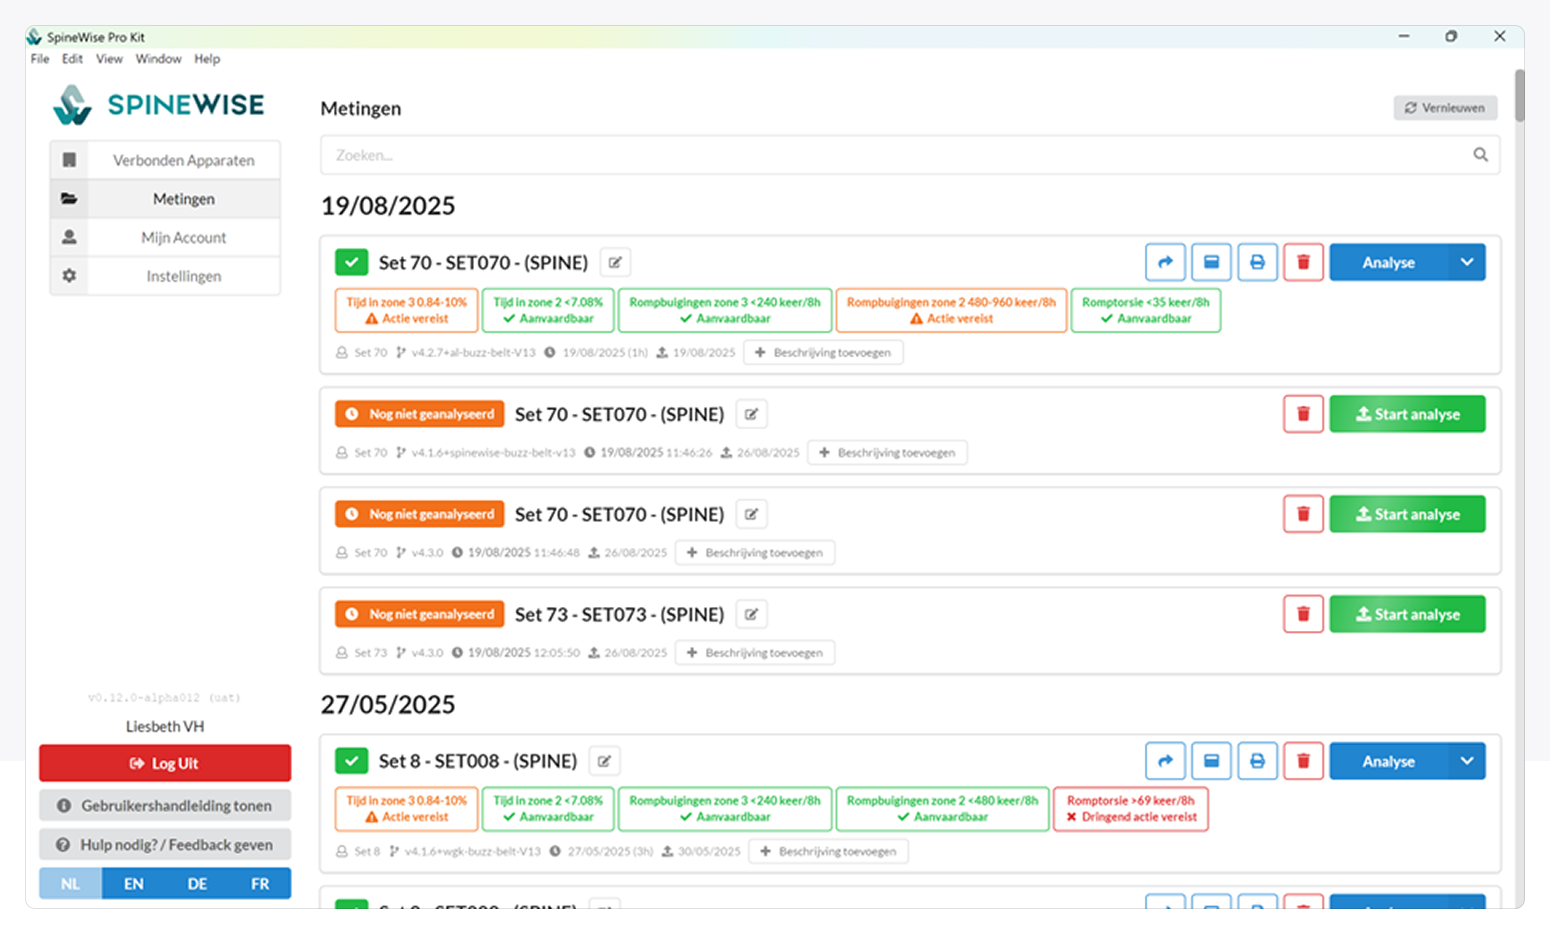
Under Measurements you can view the recorded measurements. Each measurement is separated by a new calibration. Here you see the name of the set and, if available, a corresponding description. You can adjust both the name and the description as you wish.
In addition, the time at which the measurement was uploaded to the platform is also shown.
For each file you can decide whether you want to process it by clicking the Start analysis button.
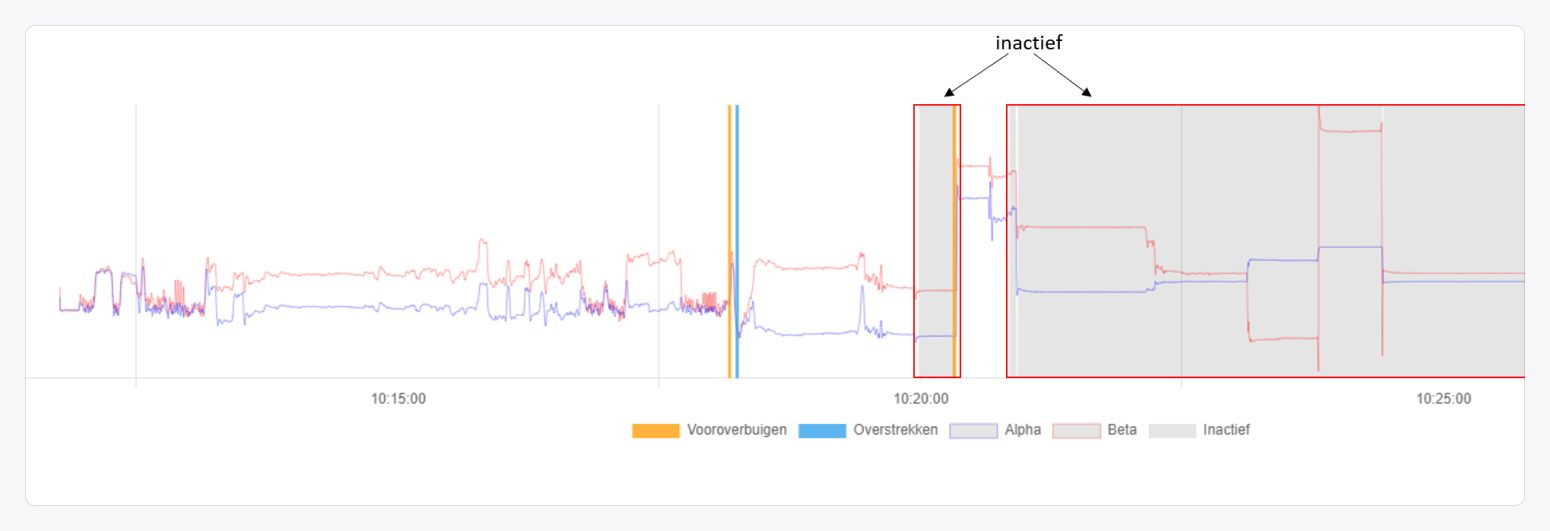
When the wearable is in an unnatural position (for example lying flat), the data is marked as inactive. (Note: this model is not perfect!)
On the timeline, inactive zones are shown in grey.
Standard indicators (ISO-related standards)
At the top of each file you see the standard indicators: compact status blocks that show at a glance whether your measurement meets the ISO-related standards. They are always α-based (trunk inclination) and fully independent of the wearable settings. β (back curvature) is never included here.
What do the standard indicators show?
- Static time in zones: how much time is spent longer than 4 seconds in certain α-zones.
- Trunk bends per zone (per 8 hours): the frequency of trunk bends in zones 2 and 3.
- Trunk torsion (per 8 hours): the frequency of trunk torsions.
Where possible, the thresholds follow the ISO framework for postures and movements according to EN 1005-4, subject to the adjustments described in 'measured parameters', and are normalised to an 8-hour working day. They do not change when you adjust thresholds or the vibration signal in the wearables.
Colour coding
- Green (acceptable): within the standard.
- Orange (action required): point of attention to monitor.
- Red (urgent action required): clear exceedance, high priority.
Usage tip
Think of the standard indicators as a quick OK/NOK check at ISO level: they tell you something about workload/task demands (via α). If you want to know how employees move (e.g. back curvature/β for coaching), open the file further: there you will also find the parameters that do depend on your wearable settings.

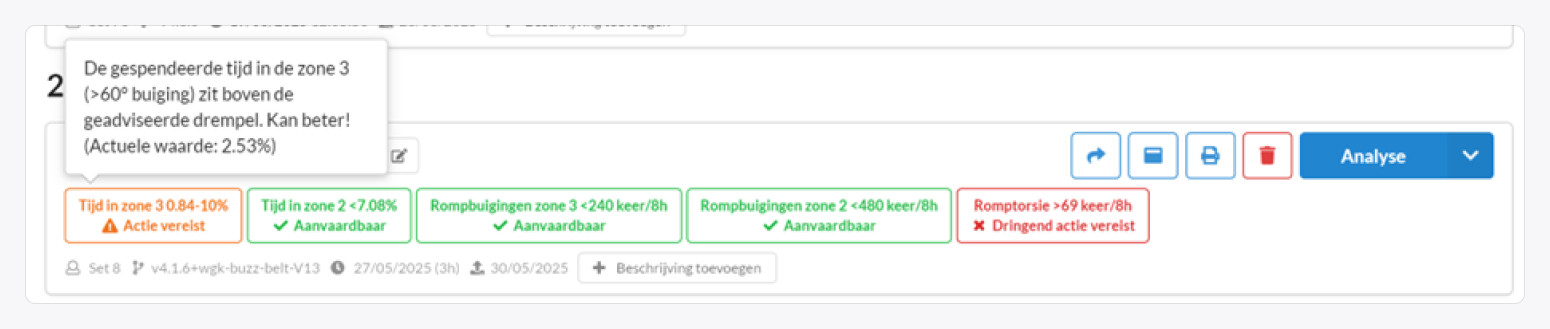
Move the mouse over a standard indicator to see an info balloon with more details:
What the different parameters measure exactly can be found under Measured parameters.
When you click Details on a measurement, you see all parameters with the recorded values.
The last 5 seconds of use are automatically removed from the dataset.
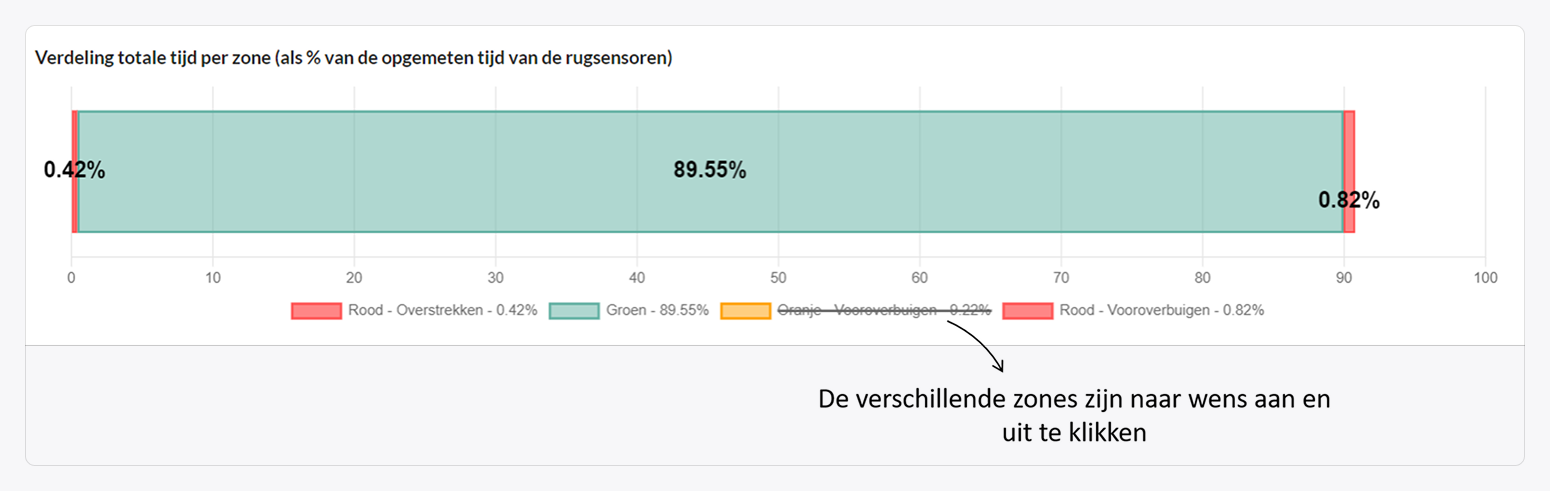
To ensure comparability with ISO 11226, the time percentage in zones is always shown based on the alpha angle, even if beta is checked in the settings.
Creating and navigating a graph
By default, two graphs are available for a measurement:
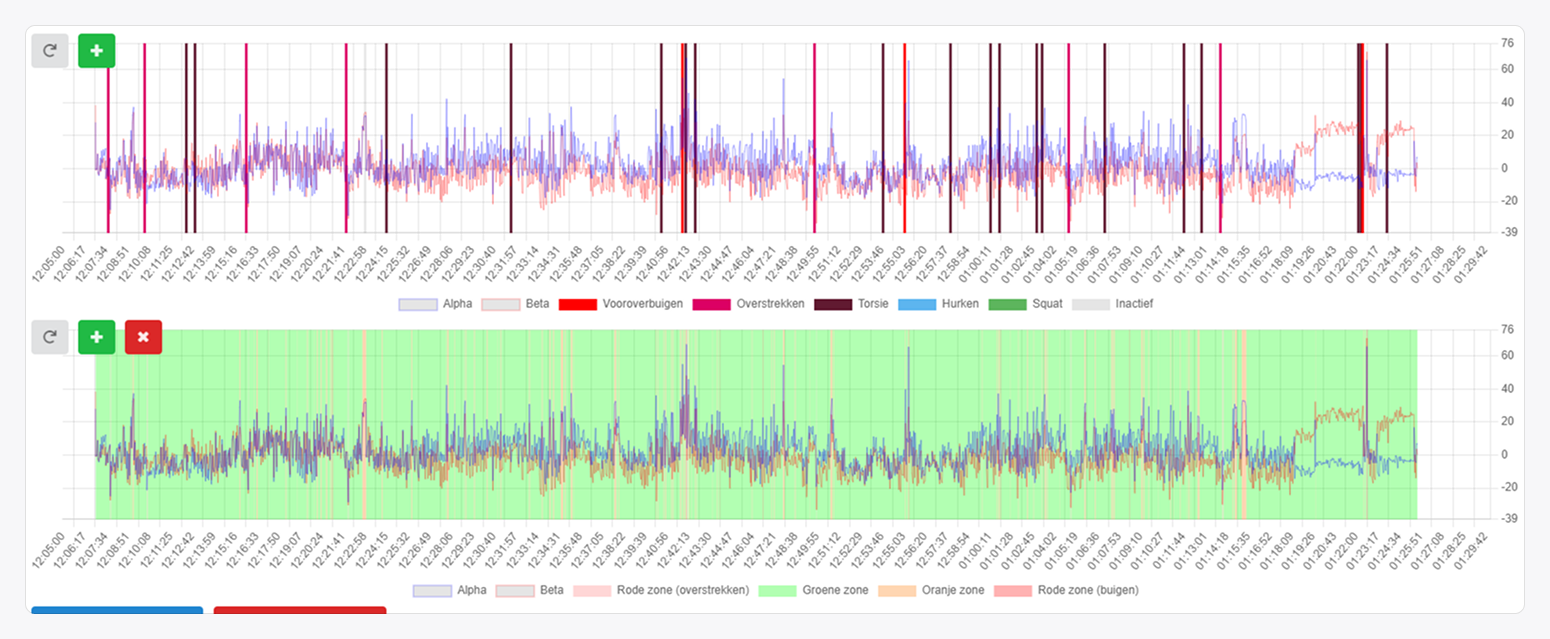
- The top graph identifies the movements: bends, overextensions, torsions, squats, …
- The bottom graph does not show the movements, but colours the graph based on the zone (based on alpha). It distinguishes Zone 1, Zone 2, Zone 3 and Zone 4.
In addition, there are options available to create extra graphs, to choose yourself what you want to visualise, or to reset the settings to the default values.
Extra options
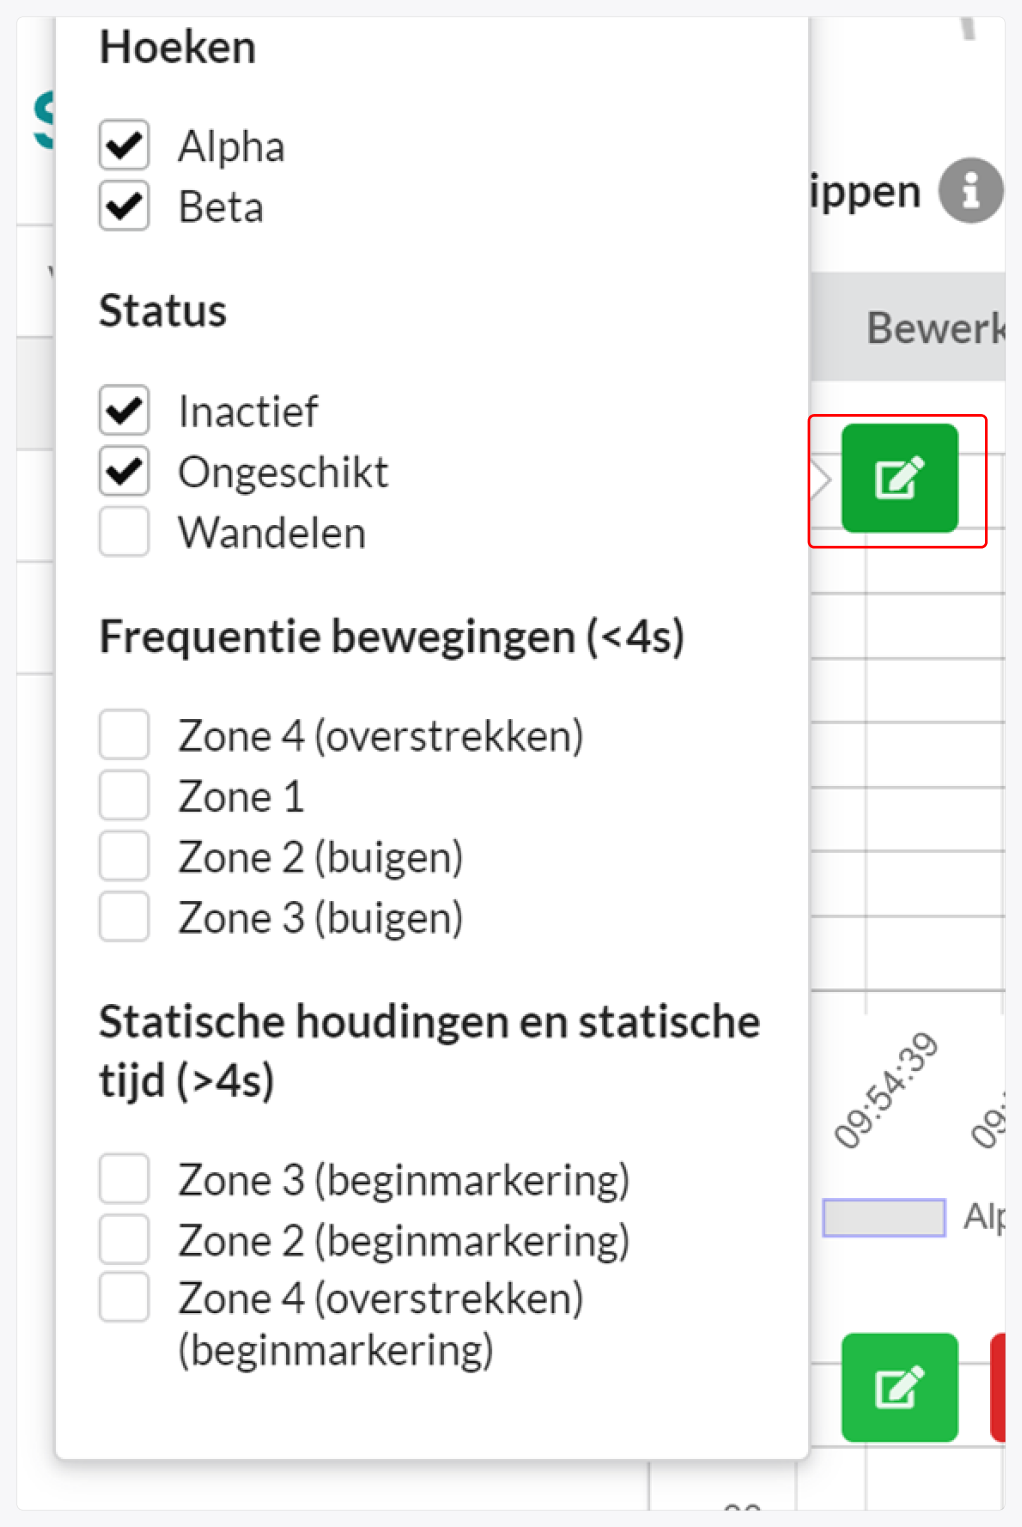
To zoom in or out on the time scale (x-axis) of the graph, use CTRL + mouse wheel up or down.
To zoom in or out on the angle scale (y-axis), use CTRL + SHIFT + mouse wheel up or down.
Graph filtering
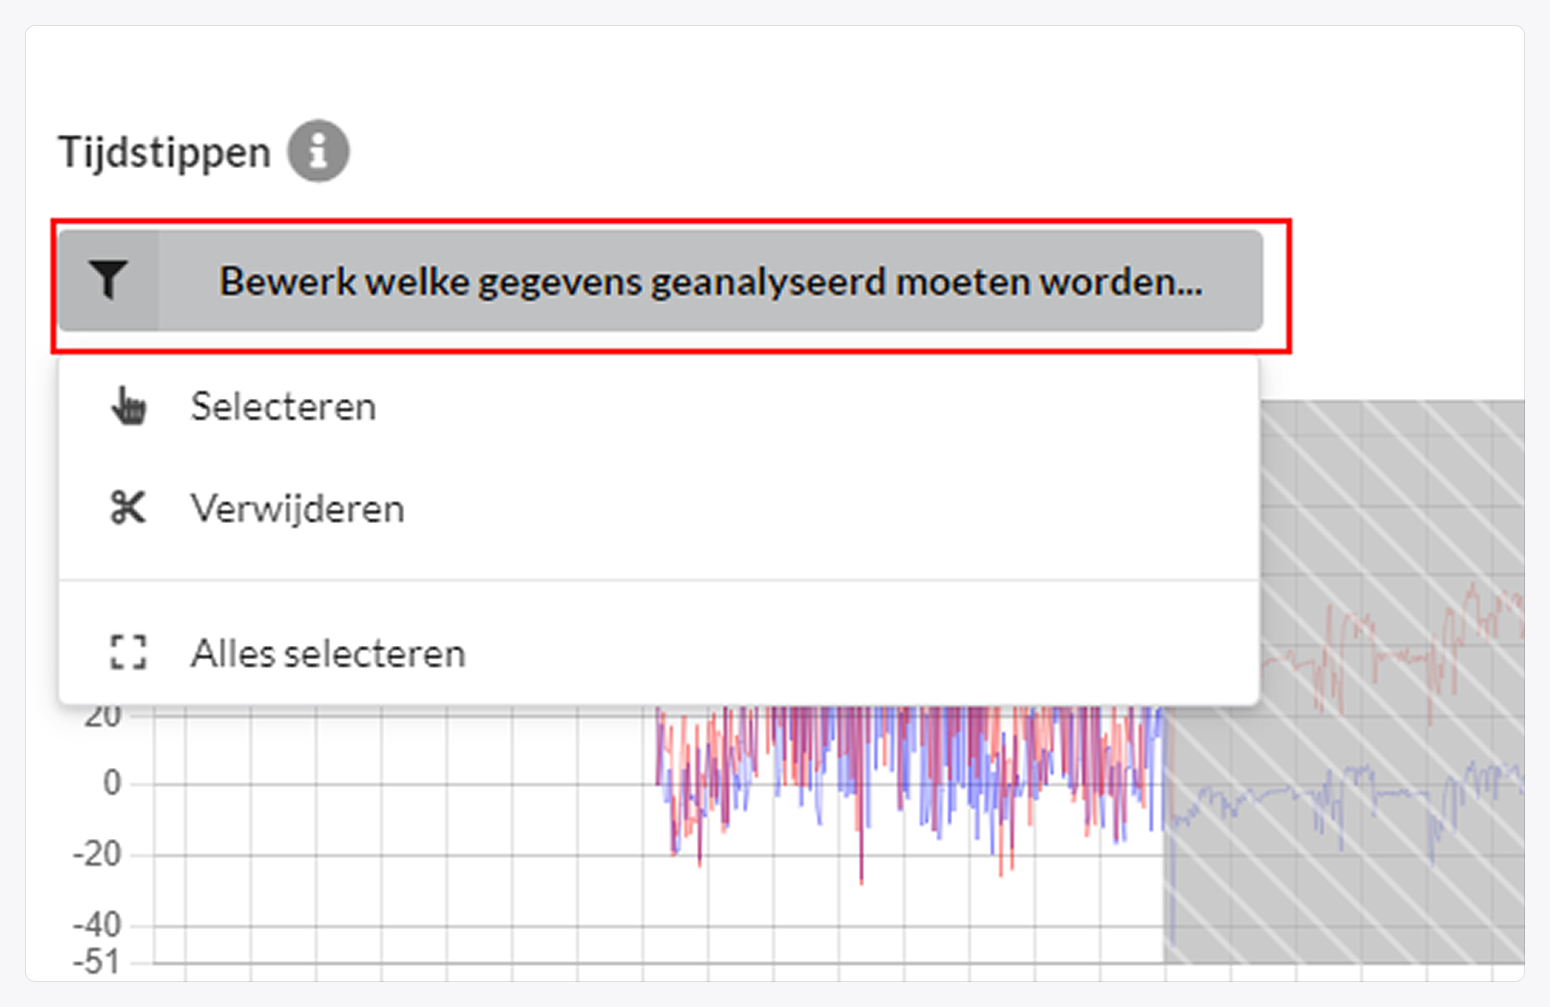
With the selection option you can remove parts of a measurement or mark them for analysis.
- Selecting: mark specific data that you want to view separately. The KPIs adjust automatically based on this selection.
- Removing: selected data is shown in grey and temporarily taken out of the selection.
- Resetting: selecting and removing is not permanent. With a double-click in the graph you restore the full selection.
With the Shift key you can select or remove multiple parts at once.
Adding files to the overview dashboard
If you want an overview of several measurements grouped together (viewing evolution graphs or viewing/comparing different jobs or tasks…), you can add the measurements to a central dashboard. This is a premium feature. For more information, send an email to info@spinewise.be.

Sharing a dataset with a user
Not all features are available if you are not the owner of a file:
- You cannot forward this file to the SpineWise portal
- You cannot share this file with others
It is possible to share a measurement with another user. That person can then see exactly the same information that has been added to this measurement (including the description and created graphs).
The sender of the measurement will need to provide a user ID when sharing. The recipient can find this by navigating to the "My Account" tab and copying the code.

Exporting as a pdf file
It is possible to make a pdf export of a completed analysis.
Make sure the analysis is open and click the Save button.

Give your feedback!
Give your feedback through the app! This way we can make our software even better.
You can also always reach us at itsupport@spinewise.be for further support.